Brainsights · Neuro+Attention Scored OOH
Better billboard buying, with Brainsights SI Maps.
Thousands of billboards scored across Canada for what gets Seen and what drives Impact. Backed by Neuroscience.
The Industry's Challenge
'Opportunity to See' isn't Seen.
OOH in Canada is traded on an Opportunity to See — traffic counts and impressions. But is anything actually Seen? And furthermore if it's seen, does it make an Impact?
Not all Impressions are created Equal.
An Impression Served is not an Impression Seen.
And an Impression Seen is not an Impression Made.
100 moments in view~19% actually in focus
The Journey: Impression → Attention → Impact
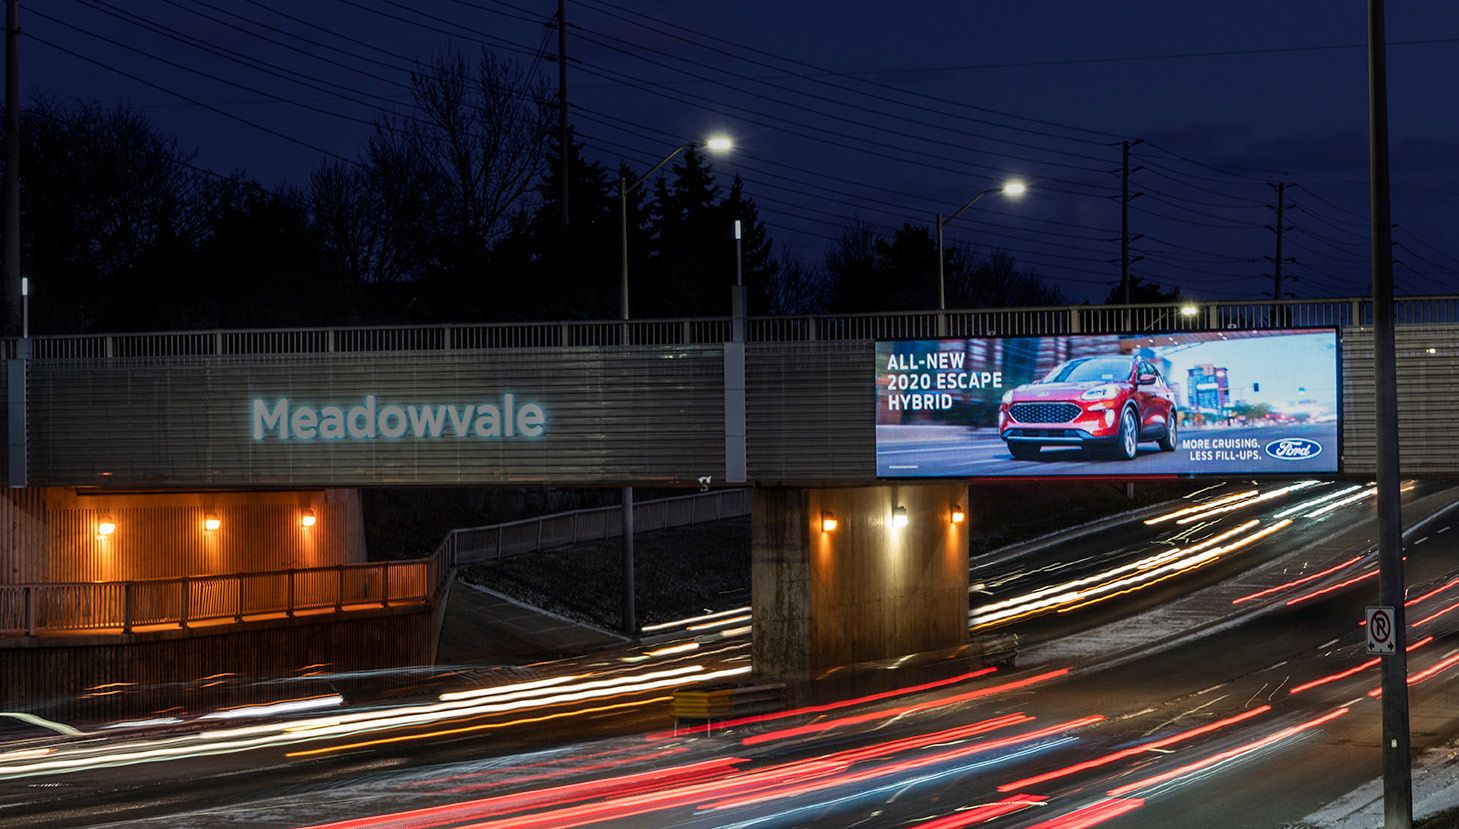
So we measured Attention and Impact on the Road.
Eye-tracking glasses and EEG headsets on real drives with real humans.
Eye-tracking glasses
EEG headset
200+ boards
Billions of data points
attention + brain waves, in context
Seen Signal · Gaze
Seconds of gaze, board by board.
We clock how long eyes actually stay on each board — and how often they come back.
From impressions served to impressions seen.
35%viewed under 1 second
77%under the 2.5s average
23%held past the average
11%held 5 seconds or more
average board: 2.5stop formats hold 4+ seconds
Seen Score
Impact Signal · EEG
Impact — did the brain engage?
Second-by-second brain response in the moment of exposure — four readings, one Impact Score.
Peak attention
Emotional connection
Memory encoding
Message immersion
Four readings, one momentevery band spikes on exposure
Impact Score
From impressions seen to impressions made.
Sign up to view the study white paper for full methodology.
Seven readings. One score.
From drives to data
Scored coast to coast.
Neuroscience + eye-tracking of real humans + machine learning. The study is the foundation — built out into a scored universe of thousands of assets across Canada.
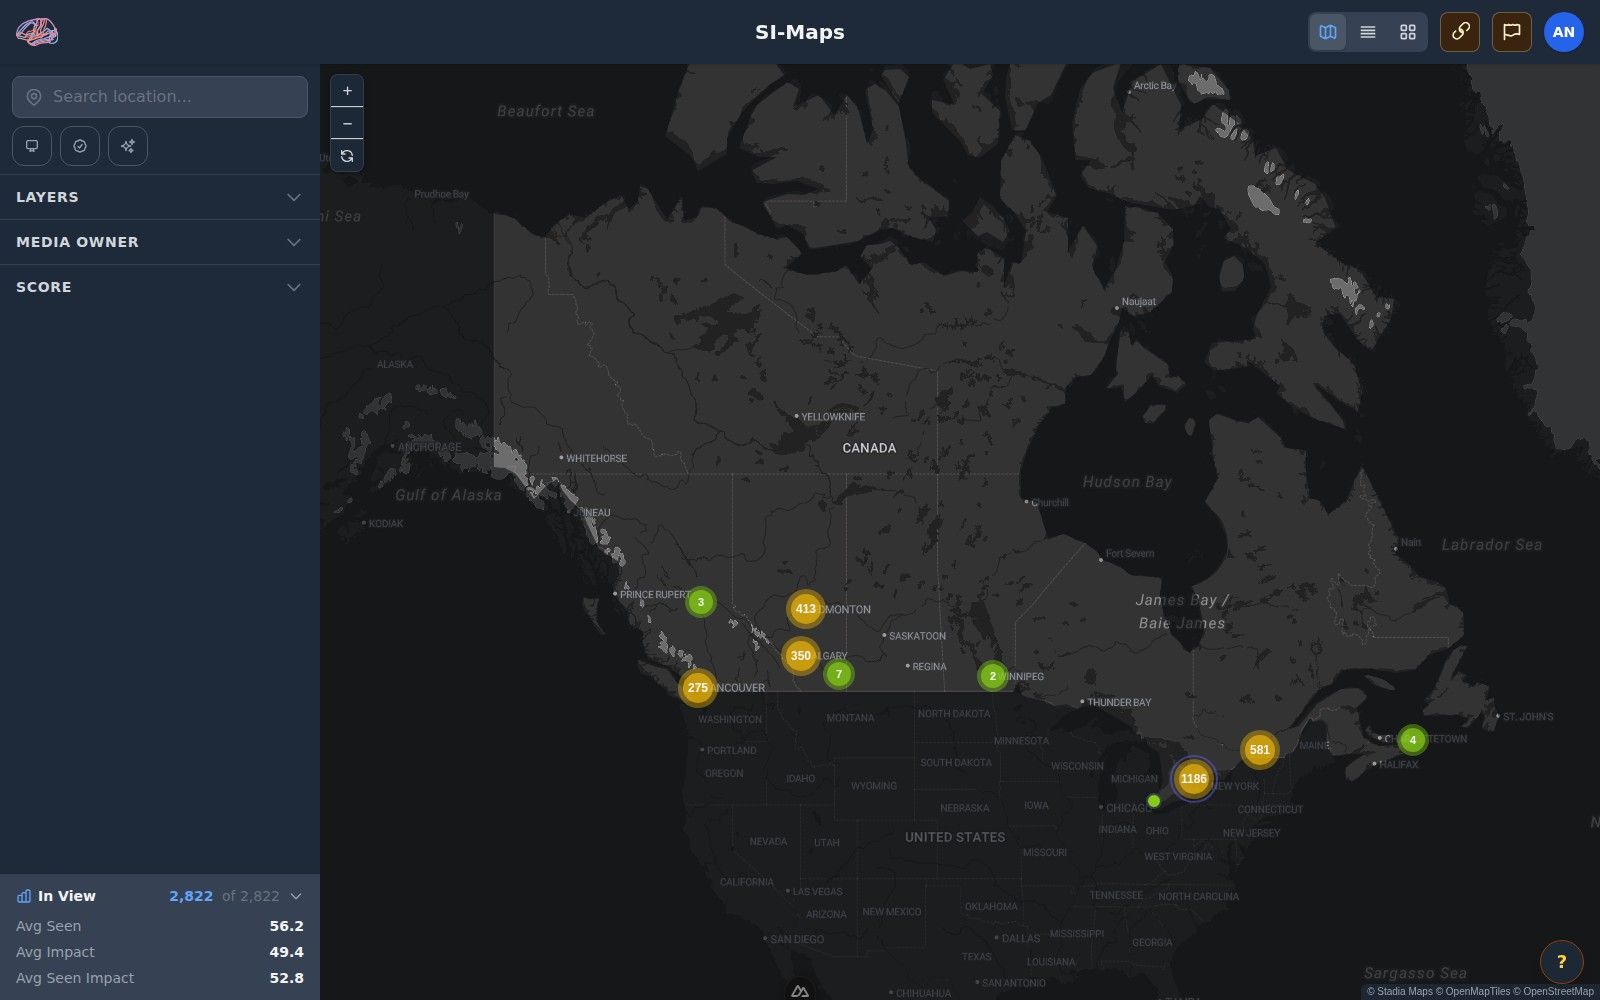
200+ boards observedthousands of boards scored
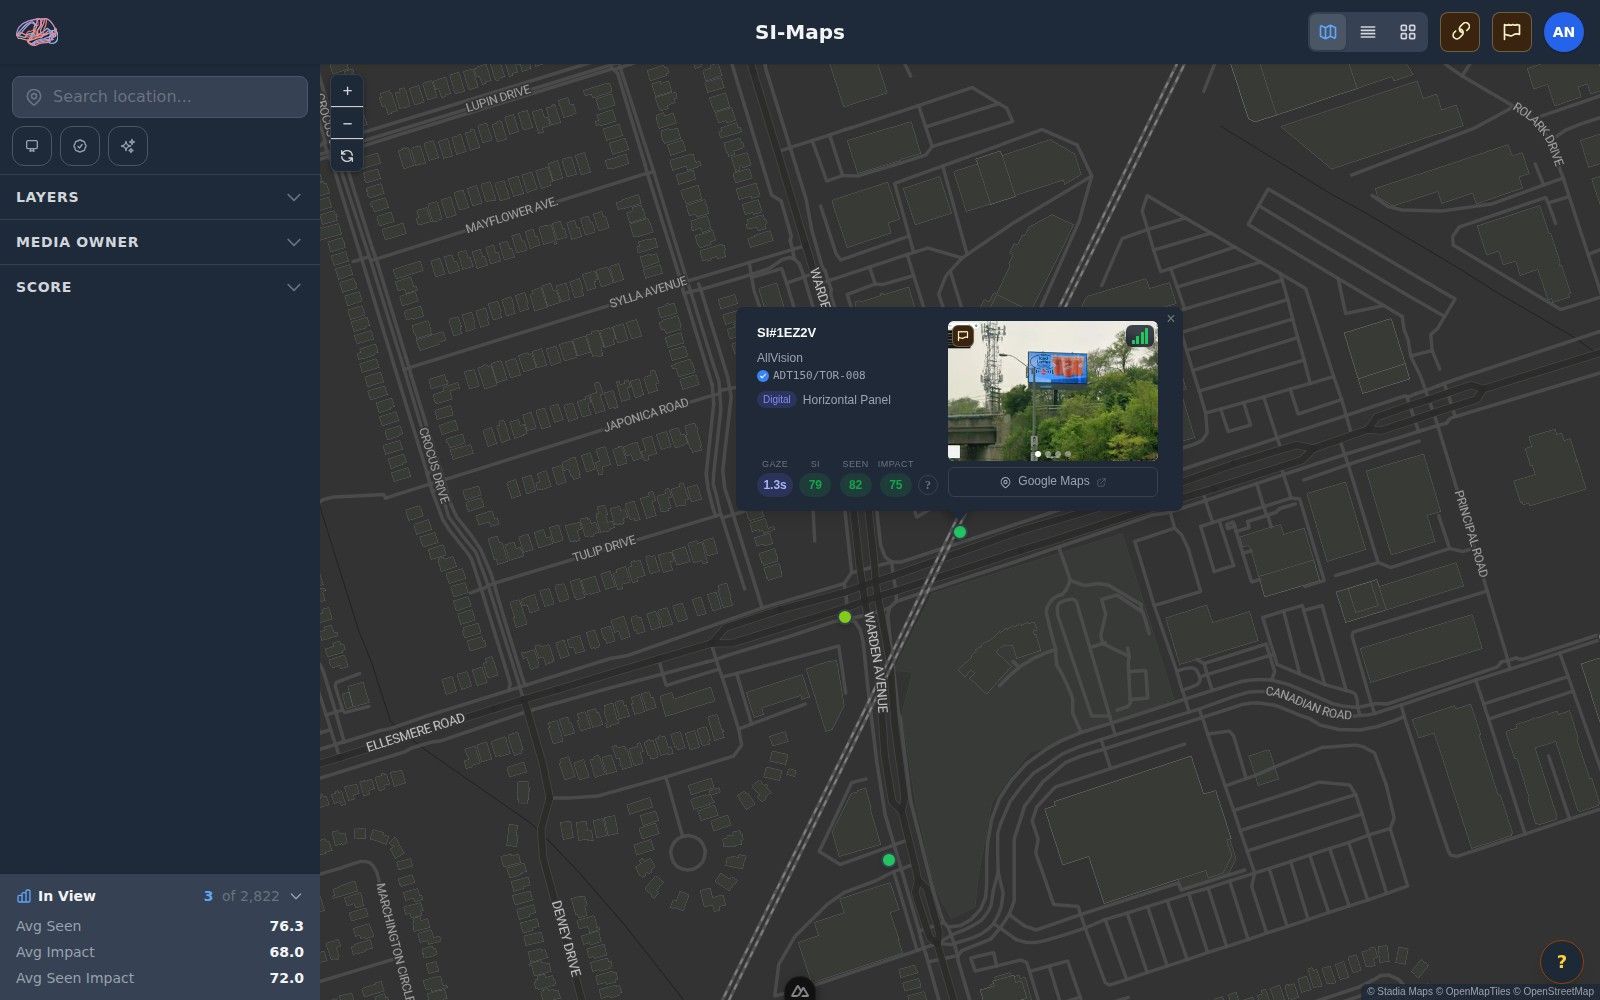
SI Maps
See the signal before you book the board.
Better billboard buying by understanding which boards are seen and the impact they make. Filter by format, location and score.
Gaze
Seconds of focused gaze.
Seen
Did eyes find it — and stay?
Impact
Did the brain respond?
Seen Impact
One signal on every pin.